
Key Points:
- SP500 futures fall 0.4%, closing at 6258.80 after hitting a high of 6296.05
- Trump imposes 35% tariffs on Canadian imports and targets EU with trade letter
- Traders await Q2 earnings, led by JPMorgan’s results on Tuesday
U.S. stock markets turned lower on Friday after President Donald Trump ramped up his global tariff campaign, this time aiming squarely at Canada and the European Union. The S&P 500 closed at 6258.80, after hitting an intraday high of 6296.05, retreating by 0.39% as momentum sharply reversed during the U.S. morning hours
The pullback came in sync with Nasdaq and EUROSTOXX 50 futures, which fell 0.4% and 0.6%, respectively. The president announced a 35% tariff on all Canadian imports, effective August 1, and hinted at blanket 15–20% duties on “other nations.” A formal warning to the EU is reportedly imminent.
Dollar Strengthens Amid Trade Fallout
Currency markets reflected the shift in risk sentiment. The euro slipped 0.3% to $1.1668, while the greenback climbed 0.4% to C$1.3704. The market reaction was swift but restrained, as traders weighed the credibility of the August 1 tariff deadline.
While Trump initially granted a delay earlier in the week, analysts like Joseph Capurso from CBA expressed doubt that ten more trade agreements could be reached in time. This raises the risk of sharp tariff hikes next month—unless another extension is quietly rolled out.
Technical Analysis
The SP500 is retreating after printing a local high at 6296.05, with the index closing at 6258.80, down 0.39% intraday. This sharp drop comes after a steady grind higher throughout the 10th of July, but a late-session selloff triggered a clean break below short-term support near 6270, dragging prices toward the 6250 zone.
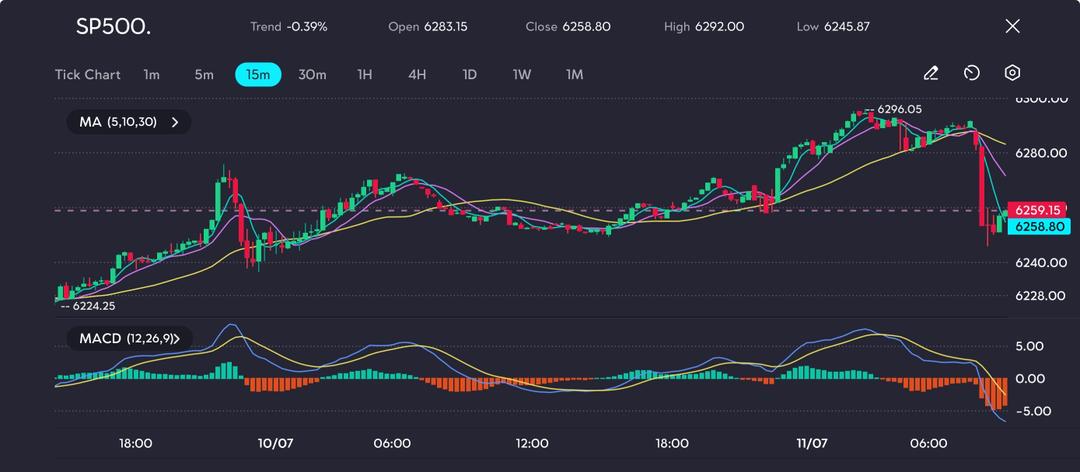
Picture: SP500 drops below 6270 ahead of CPI. Momentum weakens as bears take short-term control, as seen on the VT Markets app
The 5- and 10-period moving averages have sharply turned lower, while the 30-period MA is flattening—signalling a potential reversal or deeper pullback if support breaks. The MACD shows strong bearish divergence, with a steep drop in histogram bars and a cross below the signal line. Momentum is clearly fading after the recent rally.
Earnings Season: Calm Before the Storm?
Despite the policy headwinds, Wall Street had previously reached new highs, led by Nvidia’s market cap topping $4 trillion. But now, focus shifts to Q2 earnings, with JPMorgan Chase kicking off the season on Tuesday.
Traders will watch closely to see if firms have absorbed or passed on cost pressures stemming from Trump’s trade war, which began in earnest on April 2. The reporting cycle could either reinforce the recent highs—or act as the catalyst for a correction if forward guidance disappoints.