
Key Points:
- Brent and WTI both rose 0.5% to $70.49 and $68.68 respectively, despite rising U.S. crude stockpiles
- API data showed U.S. inventories surged by 1.7M barrels—the biggest increase since January
Crude oil prices continued their cautious climb, with WTI futures (CL-OIL) closing at $68.653, up from an intraday low of $67.768. The day’s high marked $68.893, flirting with a key resistance level seen just below the $69 handle
Brent crude also rose 0.5% to $70.49, buoyed by technical recovery momentum. Traders, however, remain wary of escalating global trade uncertainty, especially following Trump’s 50% tariff announcement on copper and upcoming deadlines for broader trade negotiations.
Inventory Spike Casts a Shadow
Adding pressure to the bullish sentiment, the American Petroleum Institute (API) reported a 1.7 million-barrel build in U.S. crude inventories last week. If confirmed by the EIA’s report later today, it would mark the largest inventory gain since January.
Such a rise suggests softening domestic demand or persistent supply resilience, both of which could dampen the case for sustained upward momentum in oil prices. The $68.90–$69.00 zone now acts as a psychological barrier, with further upside likely requiring either a geopolitical disruption or a draw in inventories.
The Elephant in the Room
President Trump’s mixed messaging continues to blur the oil demand outlook. While he has hardened his stance on the August 1 trade deal deadline, analysts at IG suggest the markets are beginning to adapt to Trump’s policy manoeuvres, treating them as bargaining tools rather than fixed triggers.
Still, the broader fear remains: if tariffs reduce global industrial output and limit transportation volumes, oil demand could shrink in the quarters ahead. This is especially critical with summer driving season nearing its peak.
Technical Analysis
Oil prices have pulled back after reaching an intraday high near $68.90–$69.00, with the 5, 10, and 30‑period moving averages now converging around $68.60, signaling a potential short-term equilibrium.
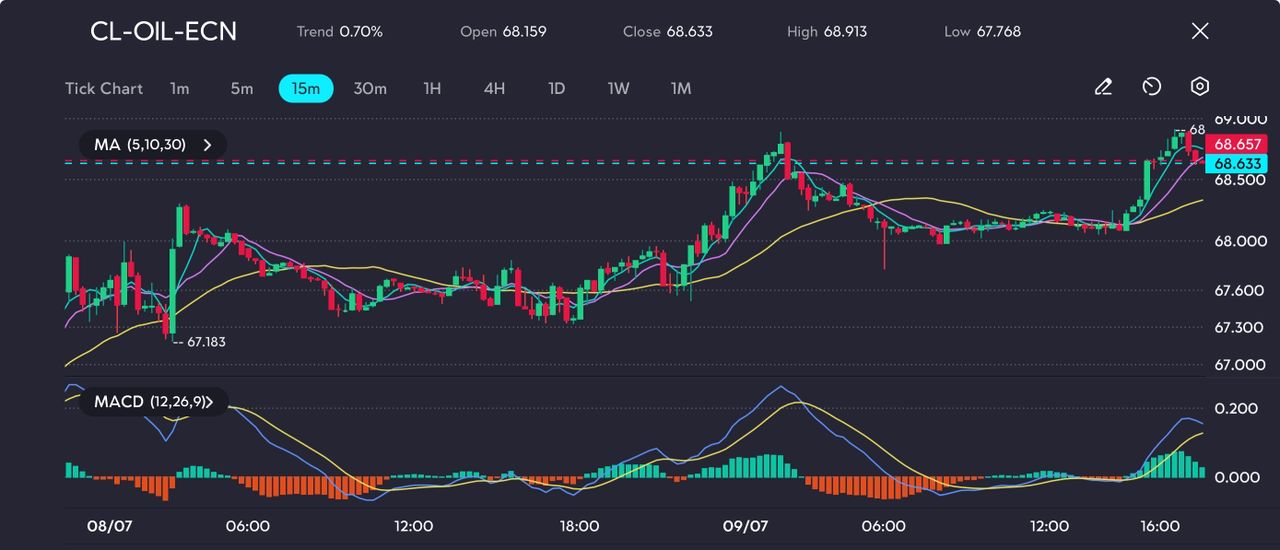
Picture: Oil consolidates near $68.60, holding key support at $66.95, as seen on the VT Markets app
The MACD histogram has turned slightly bullish, but the MACD line remains just above the signal, suggesting weak upward momentum rather than a strong reversal. Key support lies at the recent low near $66.95, a level reinforced by both the 30‑MA and prior consolidation zone. If this level holds, a retest of the $69.00–$69.20 resistance range is likely.
A clean break above $69.00 could open the door to a move toward the next resistance around $69.50–$69.80, coinciding with last week’s highs. Conversely, a drop below $66.95 would risk deeper retracement toward $66.00 or even challenge the pre‑June lows near $65.00.