
Key Points:
- S&P 500 closes at 6,315.17, up from intraday low of 6,203
- 15-min chart shows bullish momentum with soft MACD flattening
- Global traders reallocate as UK equities rebound and FX shifts bite
Wall Street continues its slow-motion rally, with the S&P 500 climbing to 6,315.17 at close, just shy of its session high. It’s not fireworks—it’s finesse.
The S&P 500’s measured tone stands in contrast to the FTSE 100, which has jumped nearly 10% year-to-date and finally outperformed Europe.
In dollar terms, it’s up close to 18%, thanks in part to currency strength. But the FTSE’s resurgence is more about catch-up than leadership.
In contrast, US stocks remain the benchmark for global sentiment. Even as the pound strengthens and the UK government attempts to rebrand its market as investment-friendly, the S&P’s dominance remains clear. With a forward P/E of 23, American equities still command the highest valuations—and for now, traders are willing to pay up.
Momentum Holds, but Eyes on Earnings
What’s keeping the SP500 moving? For one, earnings season has been better than feared. So has US inflation. The softening CPI print has renewed speculation that rate cuts might be back on the table, even as Fed officials remain cautious.
Traders are leaning risk-on, but they’re doing it with surgical precision, preferring quality tech, large caps, and defensive sectors that can weather both economic soft spots and rate recalibration.
That leaves room for continued upside, but the lack of strong volume or volatility means a breakout could be fragile. The S&P is walking a tightrope: it’s winning, but only by inches.
Technical Analysis
The S&P 500 has been climbing steadily since the dip to 6203 on 17 July, with a near-unbroken run of higher highs and higher lows, now resting just below resistance at 6315.93. The short-term moving averages remain in strong bullish formation (5 > 10 > 30), with price action hugging the trend closely.
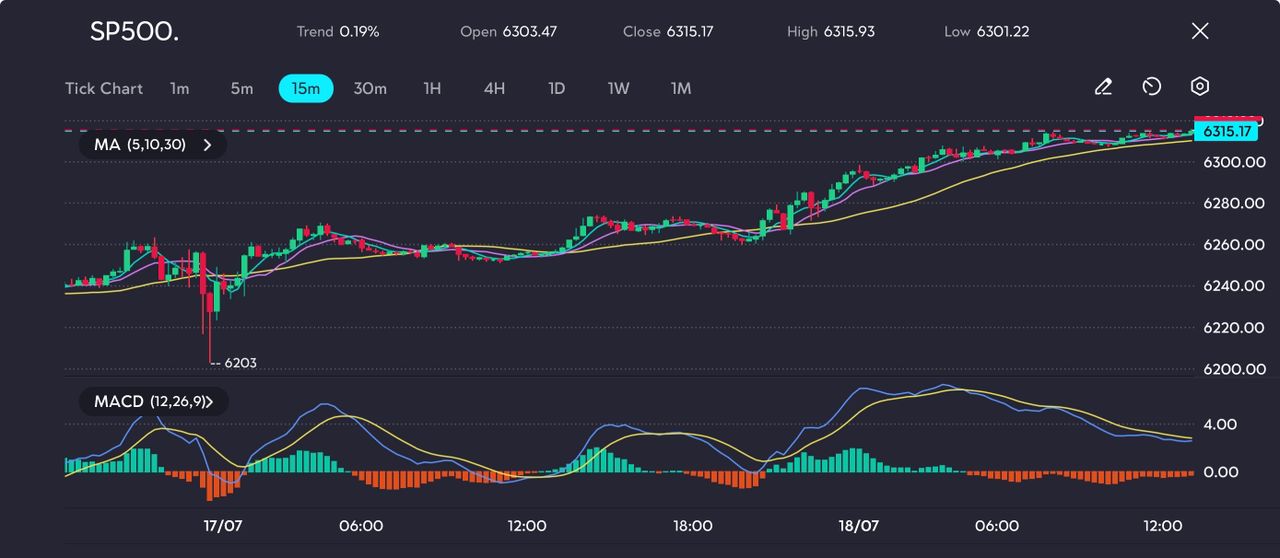
Picture: S&P 500 inches toward resistance—momentum fading, but bulls still in control above 6300, as seen on the VT Markets app
However, MACD momentum is waning—the histogram bars are shrinking and the MACD line is flattening near the signal line, hinting at a potential pause or slight pullback. A break above 6315.93 would open the door for further gains, potentially targeting 6330+. Conversely, failure to clear this level might bring consolidation or a mild correction toward 6300 or 6280 support zones.
This chart shows a textbook stair-step climb, but bulls may need new catalysts to maintain this pace.
A Calm Before the Catalyst?
As we move toward the next round of Fed remarks, earnings, and macro prints, the S&P seems to be biding its time. There’s no sense of urgency—only discipline. The uptrend remains intact, and the lack of downside pressure continues to draw capital from the sidelines.
Unless something breaks the narrative, the SP500 could continue its ascent, one cautious step at a time.