Key Points:
- The S&P 500 faced continued market volatility, opening at 5,093.9 and closing at 5,132.33.
- The MACD indicator showed a positive crossover, signaling potential upward momentum.
- The S&P 500 is showing signs of consolidation after sharp movements.
S&P 500 Struggles Amid Ongoing Market Uncertainty
The S&P 500 witnessed notable volatility on Monday, reflecting broader market concerns surrounding global trade tensions and recession risks. As President Donald Trump’s tariffs continue to take shape, the S&P 500 opened at 5,093.9 and closed at 5,132.33, down 0.75% from the previous session’s close.
The overall market sentiment remains cautious as investors weigh the impact of these escalating trade tensions on corporate profits—the S&P 500 could potentially face deeper declines in the coming months, especially if economic conditions worsen. Notably, the fear gauge, or VIX, has surged, indicating heightened market uncertainty.
Technical Indicators: The S&P 500’s Path Forward

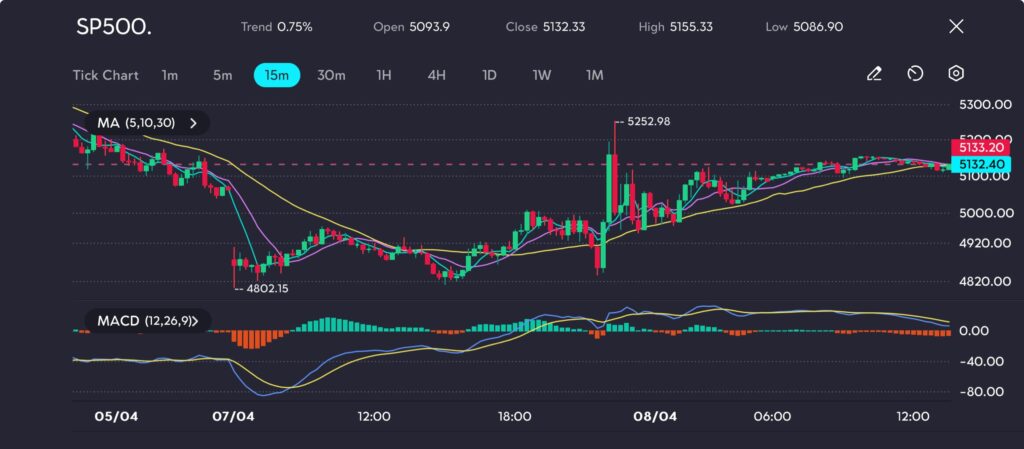
Picture: SP500 finds resistance at 5252.98, eyes further bullish moves, as seen on the VT Markets app.
Despite Monday’s closing loss, there are signs of potential upward movement in the S&P 500. The 15-minute chart shows a moderate uptrend, closing at 5132.33. The index experienced a high of 5155.33 and a low of 5086.90, showing consistent price action throughout the period.
The MACD (12,26,9) indicates bullish momentum, with the MACD line (blue) above the signal line (yellow), supported by a positive histogram. However, broader market concerns remain the dominant force shaping the index’s performance
Key support is seen at 4802.15, while immediate resistance is set at 5252.98. Monitoring these levels will provide insight into potential breakout or breakdown scenarios.
Global Market Sentiment and the S&P 500’s Outlook
The market remains on edge with the ongoing trade war fears and the potential for further economic disruptions. The S&P 500 may continue to face downward pressure, especially if corporate earnings fail to meet expectations. The forward price-to-earnings (P/E) ratio of the S&P 500 has dropped to 18.4, still above the long-term average of 15.8, highlighting concerns about overvalued stocks.
A Crucial Juncture for the S&P 500
The S&P 500 is at a critical juncture as it attempts to navigate through the uncertainty caused by ongoing trade tensions. Traders will be watching closely for any signs of relief from the tariff situation or further policy shifts from the Federal Reserve.
Given the current market conditions, the S&P 500 could face further challenges if economic growth slows or if the trade war continues to escalate.


