
Key Points:
- The US dollar strengthened as Fed inflation fears overshadowed a weak US jobs report.
- Traders await Bank of Japan meeting minutes for clues on future interest rate hikes.
- Technical analysis shows currency momentum is fading after its recent spike, signaling caution.
The Japanese yen retreated on Monday, with the dollar-yen exchange rate pushing toward the 148 level. The move has erased some of the yen’s gains from the previous trading session.
On Friday, the US Bureau of Labor Statistics released a soft jobs report for July. The report initially fuelled trader expectations that the Fed would cut interest rates soon. However, several Fed officials have since urged caution.
A key risk they cite is President Trump’s policy of wide-ranging import tariffs. Administration officials are considering fresh tariffs on consumer electronics, which could directly impact prices.
This hawkish commentary has helped the US dollar recover its footing, putting pressure on the yen.
Next Steps
In Japan, traders are looking ahead. They await the release of the minutes from the Bank of Japan’s most recent policy meeting. The minutes may offer clues about the timing of Japan’s next interest rate hike. At its last meeting, the BOJ kept its policy rate unchanged.
The bank did, however, raise its forecast for inflation. BOJ officials also flagged their growing unease about the impact of global trade tensions on Japan’s economy.
Technical Analysis
We look to the charts for more insight.
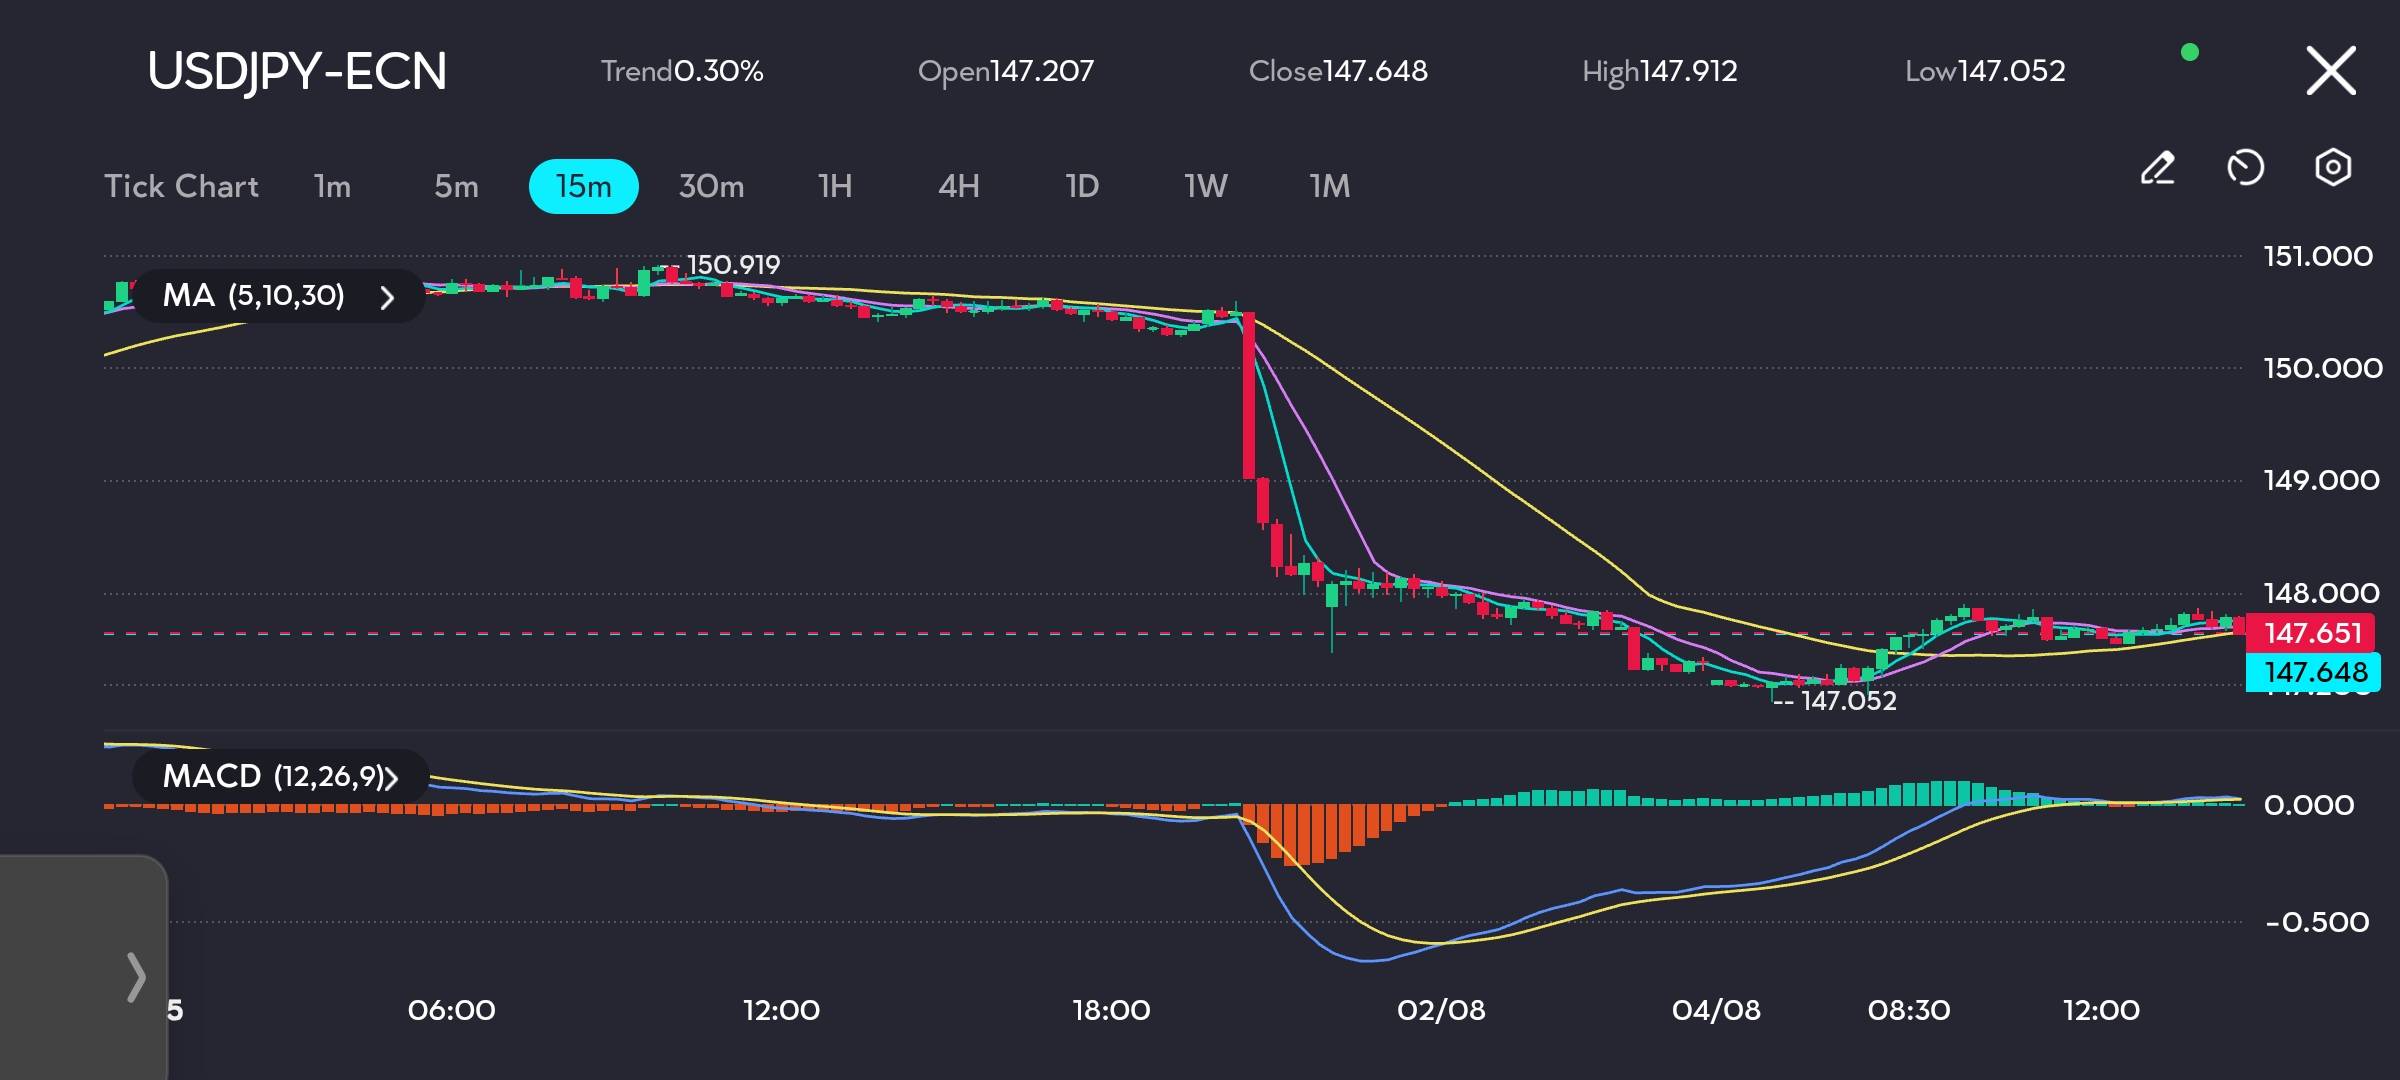
The currency pair is experiencing a period of consolidation after a sharp upward movement late last week. An analysis of the 15-minute chart shows the pair trading in a defined range, roughly between 1.1550 and the recent high of 1.1597. Before this, the price was stable around the 1.1420 mark.
The price action now shows a market pausing to digest the move. The moving averages (MAs) on the chart are tightly coiled around the current price. When MAs flatten and move sideways with the price, it typically signals trader indecision and a lack of a clear short-term trend. The price is using the slower 30-period MA as a dynamic level of support.
The Moving Average Convergence Divergence (MACD) indicator below the main price chart offers further insight. After the strong upward price spike, the MACD line (blue) executed a bearish crossover, dipping below the signal line (yellow).
This action points to a loss of upward momentum. Furthermore, the histogram has fallen back towards the zero line, confirming that the initial burst of buying pressure has subsided.
Remain Cautious
From the charts, we can see that a potential bearish divergence is also forming. The price registered a slightly higher high on August 4th compared to the initial peak on August 2nd, but the corresponding peak on the MACD was lower.
For some traders, this can be a warning sign that the upward trend is losing its underlying strength.
In our view, the bearish divergence on the MACD suggests caution is warranted. Traders will look for the next catalyst, which could come from upcoming US inflation data or further commentary from Fed or ECB officials regarding their future policy intentions.
A breakout from the current range will likely dictate the next short-term directional move.