
After a four-month party fueled by relentless optimism, is the market about to face the August hangover?
The market closed a strong July, with the S&P 500 and Nasdaq booking their fourth consecutive month of gains. Traders and investors alike have enjoyed a powerful rally, with the market surging roughly 28% since the spring.
Now, as we enter August, the question is whether the party can continue or if the music is about to stop.
History suggests caution. August has a reputation for being one of the weakest months for stocks, a time when markets seem to take a vacation along with the traders. In a post-election year like 2025, this trend is even more pronounced, with major indices historically posting losses between 0.8% and 1.5%.
After such a strong run-up, the market may be running on fumes, and a period of slower momentum or a pullback would not be surprising.
Markets Look Good, But Not Great
Second-quarter corporate earnings remain solid, with year-over-year growth around 6%. While this marks the eighth straight quarter of growth, it’s a significant slowdown from the nearly 17% jump seen late last year.
So far, about 80% of companies that have reported have beaten analyst expectations. However, they are clearing the bar by a smaller margin than usual. It signals that while businesses are meeting goals, the impressive upside surprises that fuel big rallies are becoming scarce.
The tech sector continues to do the heavy lifting, but without stronger performance across the board, earnings may not provide the push needed for higher stock prices.
No Room for Error
By most measures, the stock market looks expensive. The forward price-to-earnings (P/E) ratio for the S&P 500 now sits at 22.4, well above its 5-year average of 19.9 and 10-year average of 18.4.
High valuations alone don’t cause market corrections, but they make the market fragile. It means there is very little room for disappointment.
If economic data or earnings fall short of the now-lofty expectations, the subsequent pullback could be amplified. The market is priced for perfection, which is always an uncomfortable position.
All Eyes on Inflation
The economic picture is mixed. Inflation has cooled to 2.7%, moving closer to the Federal Reserve’s 2% target. The labor market is also showing signs of softening, with unemployment ticking up to 4.2%. This has led to strong speculation that the Fed may finally begin cutting interest rates in September.
However, traders are watching upcoming economic reports closely. Any surprisingly strong data on jobs or inflation could convince the Fed to delay rate cuts, which would likely dampen market sentiment.
In a classic “good news is bad news” scenario, a resilient economy could be seen as a negative if it keeps interest rates higher for longer.
Key Movements of the Week
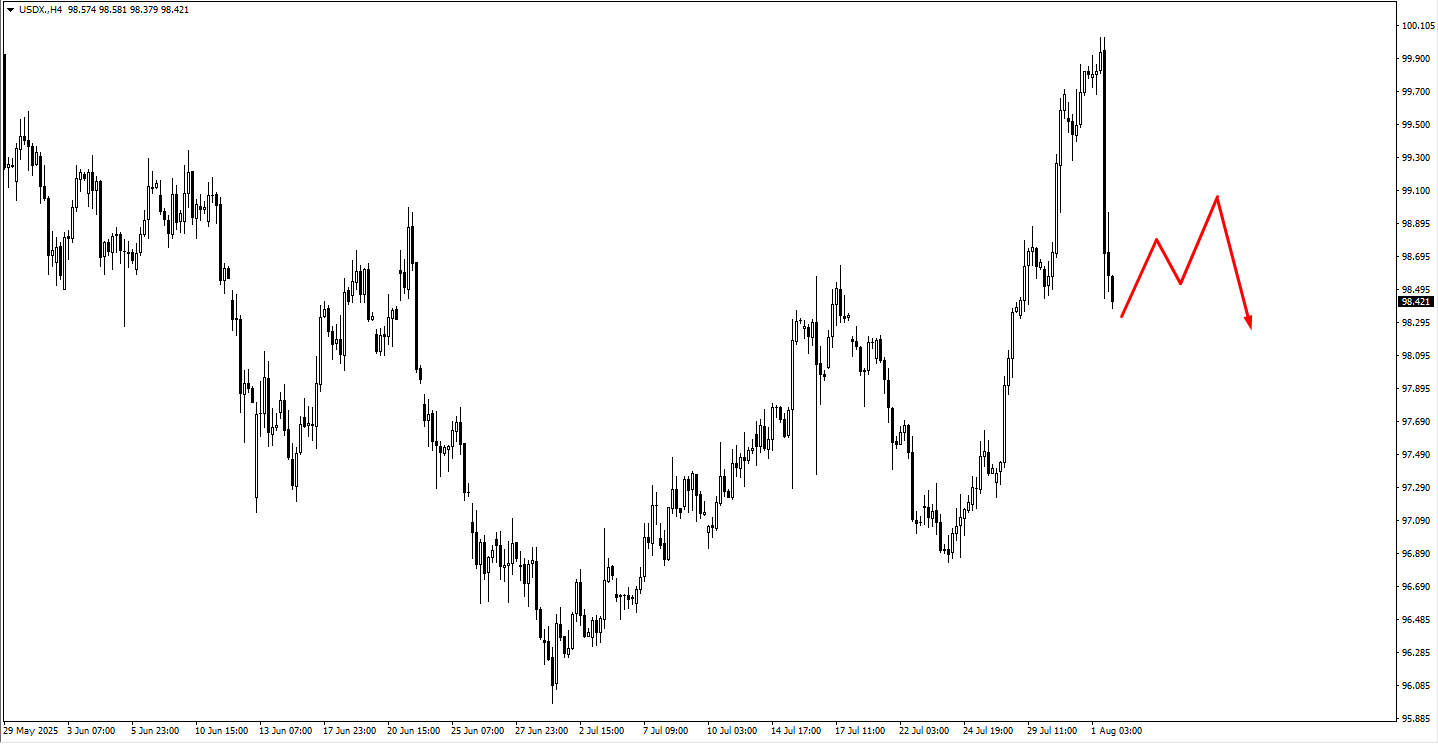
The Dollar took a significant hit following the jobs report, breaking below the key 100.20 level. The path of least resistance appears to be lower as rate cut expectations make holding dollars less attractive.
Last week’s weaker-than-expected US jobs report was the main catalyst, reinforcing the view that the Fed will cut rates and sending ripples across asset classes.
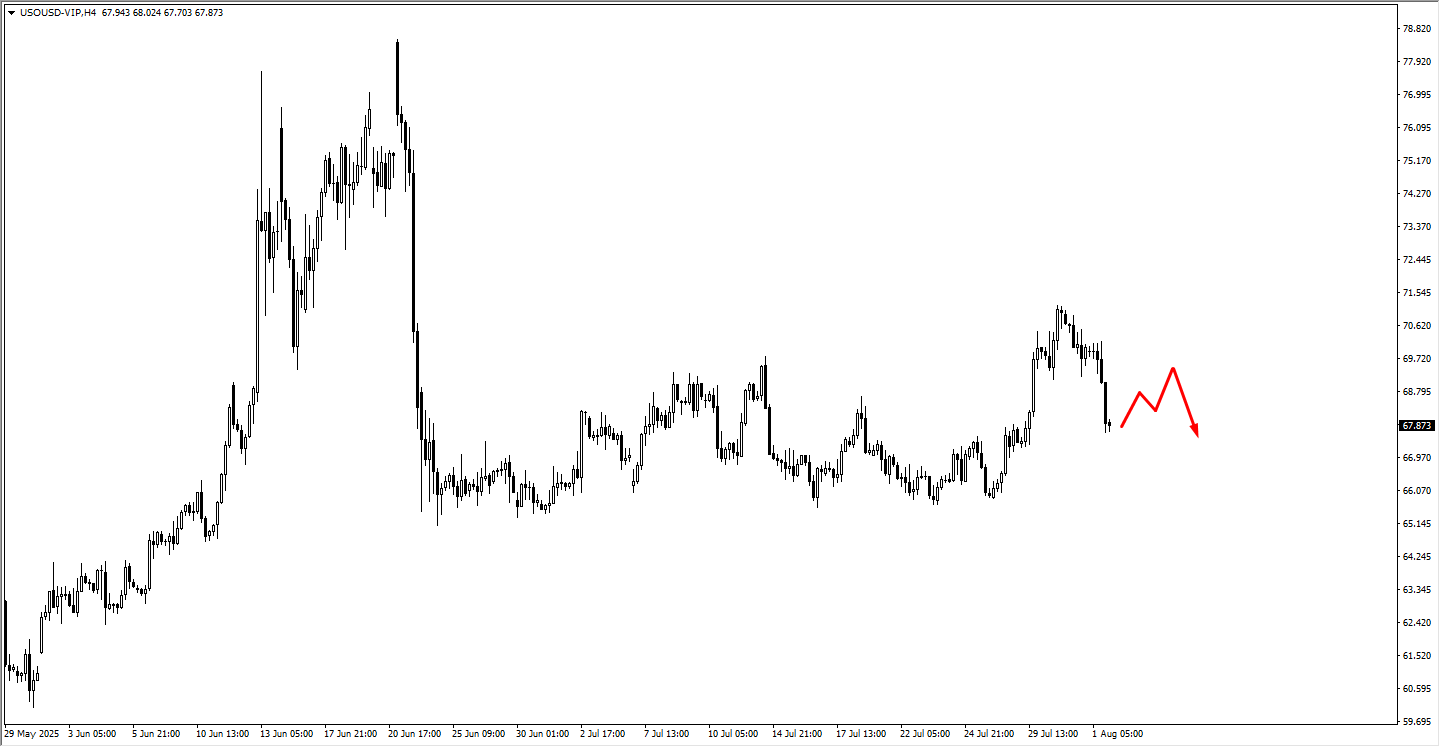
USOil is trading lower from its late-July highs of around $71.00. This decline appears to have been triggered by the recent non-farm employment news, which has introduced fresh uncertainty into the market. The price action shows a clear rejection from the upper end of its multi-week trading range, indicating that sellers have taken control in the short term.
A period of price consolidation would be a typical market response. As illustrated by the red arrow on the chart, the next key development would be a potential corrective bounce.
We suggest closely monitoring the price area around 69.30. Should the price rally to this level and show signs of weakness or bearish price action—such as failing to push higher and reversing—it could confirm that the downward momentum is likely to continue. This would establish a lower high, a classic technical signal that reinforces a bearish market structure.
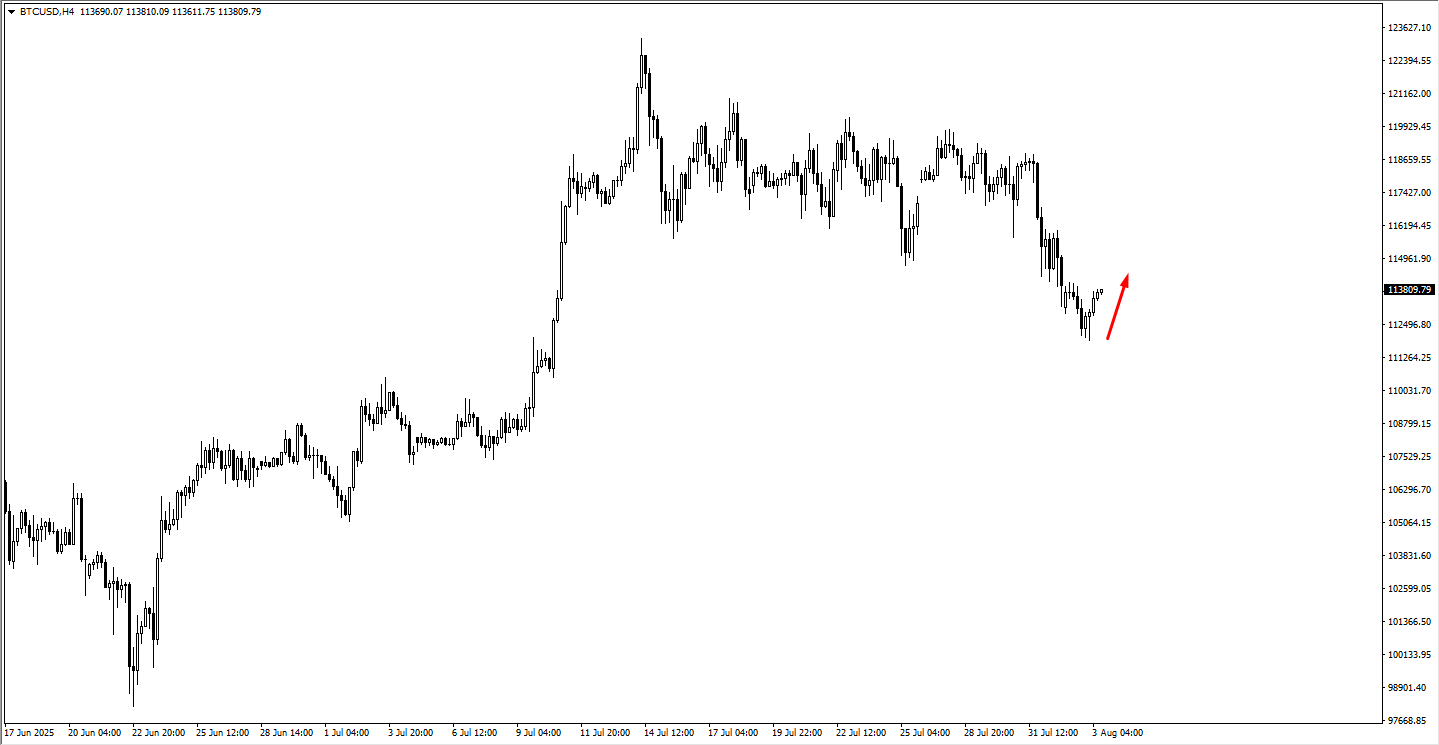
Bitcoin has recently experienced a notable decline after a period of consolidation. Following a strong rally in early July, the price entered a sideways range for several weeks, trading primarily between the $116,000 and $122,000 levels.
In late July, sellers took control, pushing the price below the support of this range, which led to an accelerated move downwards. This breakdown indicates a shift in momentum from neutral to bearish in the short term, with the market now testing lower price levels.
The price has since fallen into a monitored support zone, with the area around $111,000 being a significant psychological level for traders. After reaching a low near $112,500, the price has seen a minor bounce, as suggested by the red arrow on the chart.
More price action is needed to determine if this is the start of a sustainable recovery or merely a temporary pause in the downtrend.
Key Events of the Week
The economic calendar is relatively light, but two events will dominate attention:
Tuesday: US ISM Services PMI. On Tuesday, our attention is on the US ISM Services PMI, with the market forecasting a reading of 51.5 versus the previous month’s 50.8. After the sharp selloff in the US Dollar following the NFP report, we are watching for a potential consolidation pattern to emerge early in the week, and this data will be a key driver. The report serves as a critical update on the health of the US services sector, and we are looking to see if it confirms or contradicts the recent slowing growth narrative.
A weak number, falling short of expectations, would reinforce the view that the US economy is losing momentum. For us, this would increase the likelihood that the Federal Reserve will move to cut interest rates, likely resuming the downward pressure on the US Dollar.
Conversely, a positive ISM number that meets or exceeds the 51.5 forecast would support a consolidation or bounce in the dollar. Such a reading would challenge the slowdown narrative, suggesting the economy is more resilient than the jobs report indicated. This could force the market to re-evaluate the timing of Fed rate cuts and would likely fuel a short-term rally in the US Dollar.
Thursday: Bank of England Rate Decision. Later in the week, our focus will shift to the UK and the Bank of England’s (BoE) interest rate decision. The market widely expects the BoE to announce a rate cut from 4.25% to 4.00%. Because this is so widely anticipated, we believe the cut itself is already “priced into” the market. Therefore, the immediate price movement on the announcement may be limited.
What makes this event particularly interesting is the new dynamic created by last week’s weak Non-Farm Payrolls (NFP) report from the US. Ordinarily, the expectation of a BoE rate cut would be a clear negative for the British Pound (GBP).
However, the poor US jobs data has significantly increased expectations that the US Federal Reserve will also have to cut rates. This has created a “tug-of-war” in the GBP/USD currency pair, as both currencies are facing pressure from their respective central banks potentially easing policy.
With no major data scheduled for Friday, traders will likely use the end of the week to position for the following week’s key US inflation reports (CPI and PPI).